What Are Funding Rates and Why Do They Exist?
Perpetual futures are among the most popular crypto trading instruments on major exchanges. Their defining feature is that they have no expiration date.
Unlike traditional futures contracts, which expire on a specific date, perpetual contracts can be held indefinitely as long as margin requirements are met.
However, because they don’t expire, the price of a perpetual futures contract can move away from the cryptocurrency’s spot price.
Funding rates help keep these prices aligned.
On most major exchanges, funding payments occur every 8 hours, although the schedule can vary depending on the platform and trading instrument.
Depending on the funding rate, traders with open positions either pay or receive funding:
- Positive funding rate: Traders holding long positions pay traders holding short positions. This usually happens when perpetual futures trade above the spot price. Positive funding makes holding longs more expensive and encourages short positioning.
- Negative funding rate: Traders holding short positions pay traders holding long positions. This usually happens when perpetual futures trade below the spot price. Negative funding makes holding shorts more expensive and makes long positions more attractive from a funding perspective.
Funding rates are calculated using market data, primarily the difference between the perpetual contract price and the spot index. The exact calculation varies by exchange.
For example, a high positive funding rate may indicate strong demand for long positions and bullish sentiment among perpetual futures traders.
This means long traders are paying to keep their positions open, while short traders receive the corresponding funding payments at scheduled intervals.
Where to Find Funding Rate Data
Most major derivatives exchanges display the current funding rate and the time of the next payment directly in their trading interfaces.
For a broader view across multiple exchanges and assets, data aggregators provide real-time and historical funding rates for BTC, ETH, and major altcoins.
Key Metrics to Monitor
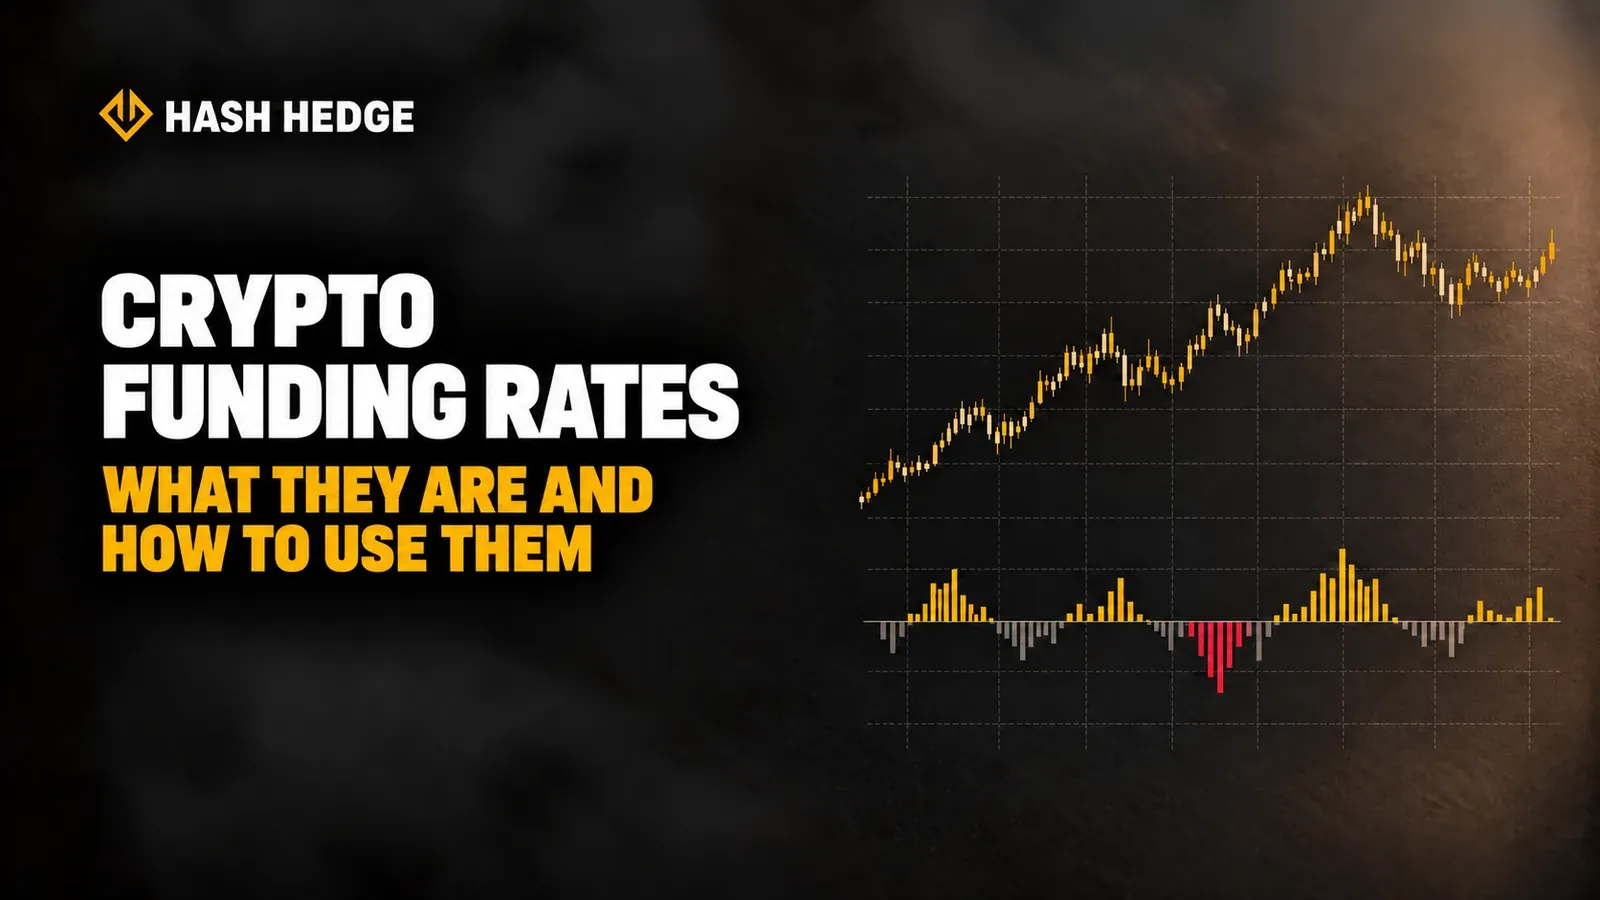
- Current Funding Rate: Expressed as a percentage, typically applied every 8 hours. A funding rate of 0.05% per 8 hours translates to approximately 54.75% annually. This means longs would pay shorts the equivalent of 54.75% per year simply to maintain their positions if the rate remained unchanged. Such elevated funding can be difficult to sustain and may precede a correction.
- Funding Rate History: The trend over several days is more informative than a single reading. Funding that remains positive and continues rising throughout the week suggests sustained directional positioning and increasing leverage.
- Cumulative Funding: Some aggregators calculate the total funding paid over a given period. High cumulative funding in one direction suggests that a significant portion of leveraged traders have maintained positions on that side for an extended period. These traders may become increasingly motivated to take profits or face growing liquidation risks.
Funding Rates as a Market Sentiment Indicator
Funding rates help you understand which direction leveraged traders are favoring and how heavily positioning has shifted toward one side of the market.
Rather than showing what traders predict, funding rates reveal which positions they’re willing to pay to maintain.
High Positive Funding: Too Many Longs
When funding rates become significantly positive, for example, above 0.05–0.1% per 8 hours, the market may be overcrowded with long positions.
This creates two main risks.
1. Holding Long Positions Becomes More Expensive
When funding is positive, long traders pay short traders.
The higher the rate, the greater the cost of maintaining a long position, especially when using significant leverage.
This can encourage traders to close positions, creating additional selling pressure.
2. The Risk of a Sharp Decline Increases
When a large share of traders is already positioned long, there may not be enough new buyers to sustain further price increases.
If prices start falling, Stop Loss orders and forced liquidations can accelerate the decline.
What Does History Show?
In BTC and ETH markets, periods of extremely high positive funding have repeatedly been followed by corrections.
However, high funding doesn’t cause a price decline by itself, and it doesn’t guarantee a reversal.
Instead, it signals an imbalance in leveraged positioning that can make the market more vulnerable to sharp price movements.
Key takeaway: The higher the positive funding rate, the more carefully you should evaluate crowded long positioning and the risk of cascading liquidations.
High Negative Funding: Too Many Shorts
The opposite situation occurs when funding rates become significantly negative, suggesting the market is overcrowded with short positions.
Short traders pay long traders to maintain their positions. The main risk is a sharp upward move that triggers short squeezes and forced buying.
Historically, periods of extremely negative funding (below −0.05% per 8 hours) have sometimes preceded sharp upward movements, including the short squeezes that periodically occur in crypto markets.
These moves can be fast and powerful because forced buying from short liquidations creates additional demand.
Neutral Funding: Balanced Positioning
Funding rates close to zero (between −0.01% and +0.01%) suggest relatively balanced long and short positioning.
In these conditions, funding data doesn’t provide a strong directional signal.
Technical analysis and market structure generally become more important when funding is neutral.
Combining Funding Rates With Technical Analysis
Funding rates work best as an additional signal for confirming trading ideas or evaluating risks, rather than as a standalone reason to enter the market.
Confirmation Signal: Funding Supports the Trade Direction
When a technical signal aligns with funding data, traders gain additional context supporting their trading idea.
- Long: A bullish order block retest in a Discount zone with neutral or negative funding. This may suggest that the market isn’t overcrowded with longs, reducing the risk of a sharp decline caused by mass long liquidations.
- Short: A reversal from a Premium zone with significantly positive funding. A high concentration of leveraged longs increases the risk of liquidations if prices decline, potentially accelerating the downward move.
Funding rates don’t determine whether a technical signal is reliable, but they help you evaluate market conditions and the risks surrounding a trading scenario.
Warning Signal: Funding Conflicts With the Trade Direction
If a long signal appears while funding is extremely positive, that’s an additional risk factor.
The market may already be overcrowded with long positions, increasing the possibility of a sharp decline and widespread liquidations before the uptrend resumes.
This doesn’t mean the technical signal is invalid. However, the additional risk should be considered when choosing your position size and placing your Stop Loss.
Your Stop Loss should be based on market structure, rather than simply placed farther away in the hope of avoiding a short-term move against your position.
Price Is Rising While Funding Is Falling: What Does It Mean?
One useful funding rate signal is a divergence between price movement and funding rate trends.
This can help traders understand what’s driving a market rally and how sustainable the trend might be.
1. Price Rises While Funding Falls
If prices continue rising while funding rates move toward neutral or negative territory, it may suggest that the rally is being supported by spot buying rather than increasing leveraged long positions.
This type of move may be more sustainable because the market is less dependent on positions carrying high liquidation risk.
2. Price Rises While Funding Increases Sharply
If rising prices are accompanied by a rapid increase in positive funding, it may indicate aggressive leveraged long positioning.
As a result, the market becomes increasingly crowded with longs, raising the risk of a sharp correction and widespread liquidations.
Before the uptrend continues, prices may temporarily decline to sweep liquidity and force some overcrowded positions to close.
Funding Rates and 8-Hour Payment Intervals
On many crypto exchanges, funding payments occur every 8 hours.
These intervals can influence trader behavior and create short-term price movements.
Major exchanges often settle funding at 00:00, 08:00, and 16:00 UTC.
Before settlement, especially when funding rates are extremely high or low, some traders close positions to avoid additional costs.
This can create temporary price pressure.
Example: When positive funding is high, selling pressure may increase 30–60 minutes before settlement.
Long traders close positions to avoid paying funding, sometimes causing a short-term price decline.
If funding remains elevated, the same pattern may repeat before the next settlement.
Important: Funding settlement times shouldn’t be used as standalone entry signals. They’re an additional factor that can help explain short-term volatility and sharp price movements that may not be obvious from technical analysis alone.
A Practical Funding Rate Monitoring Routine for Funded Accounts
You don’t need to watch funding rates constantly.
A simple routine can help you incorporate them into your trading process.
Pre-Session Check (Once per Session):
- Open a funding rate aggregator and check the current BTC and ETH funding rates.
- If funding is above 0.05% or below −0.05%, flag it as a relevant market condition for the session.
- If funding reaches extreme levels (above 0.1% or below −0.1%), treat it as a significant contrarian signal and adjust your expectations for trading setups.
Trade-Level Check:
- Before opening any position larger than your standard size, check the current funding rate.
- If your trade direction aligns with an extreme funding rate (going long when positive funding is very high or short when negative funding is very low), reduce your position size to account for the increased reversal risk.
Weekly Review:
- As part of your weekly trading journal review, note whether significant funding conditions coincided with major wins or losses.
- Over time, this creates a personal dataset showing how funding conditions affect the specific setups in your strategy.
Key Takeaways
-
Funding rates help keep perpetual futures prices close to spot prices. When funding is positive, longs pay shorts. When funding is negative, shorts pay longs.
-
High positive funding may indicate overcrowded long positioning, increasing the risk of corrections, liquidity sweeps, and mass long liquidations.
-
High negative funding may indicate overcrowded short positioning, increasing the potential for sharp upward moves and short squeezes.
-
Combine funding rates with technical analysis. Funding can help confirm trading signals and identify additional risks, but it shouldn’t be your only reason for entering a trade.
-
Watch for divergences between price and funding. If prices rise while funding declines, spot demand may be driving the move. This type of rally can be more sustainable than one fueled by aggressive leveraged long positioning.
-
Check funding rates before each trading session. It only takes a few minutes and can help you better understand market sentiment, crowded positioning, and potential trading risks.