





←
Hash Hedge Blog
STRAT 2-2 REVERSAL IN CRYPTO: HOW TO SPOT AND TRADE THE REVERSAL PATTERN
Strat 2-2 Reversal in Crypto: How to Spot and Trade the Reversal Pattern
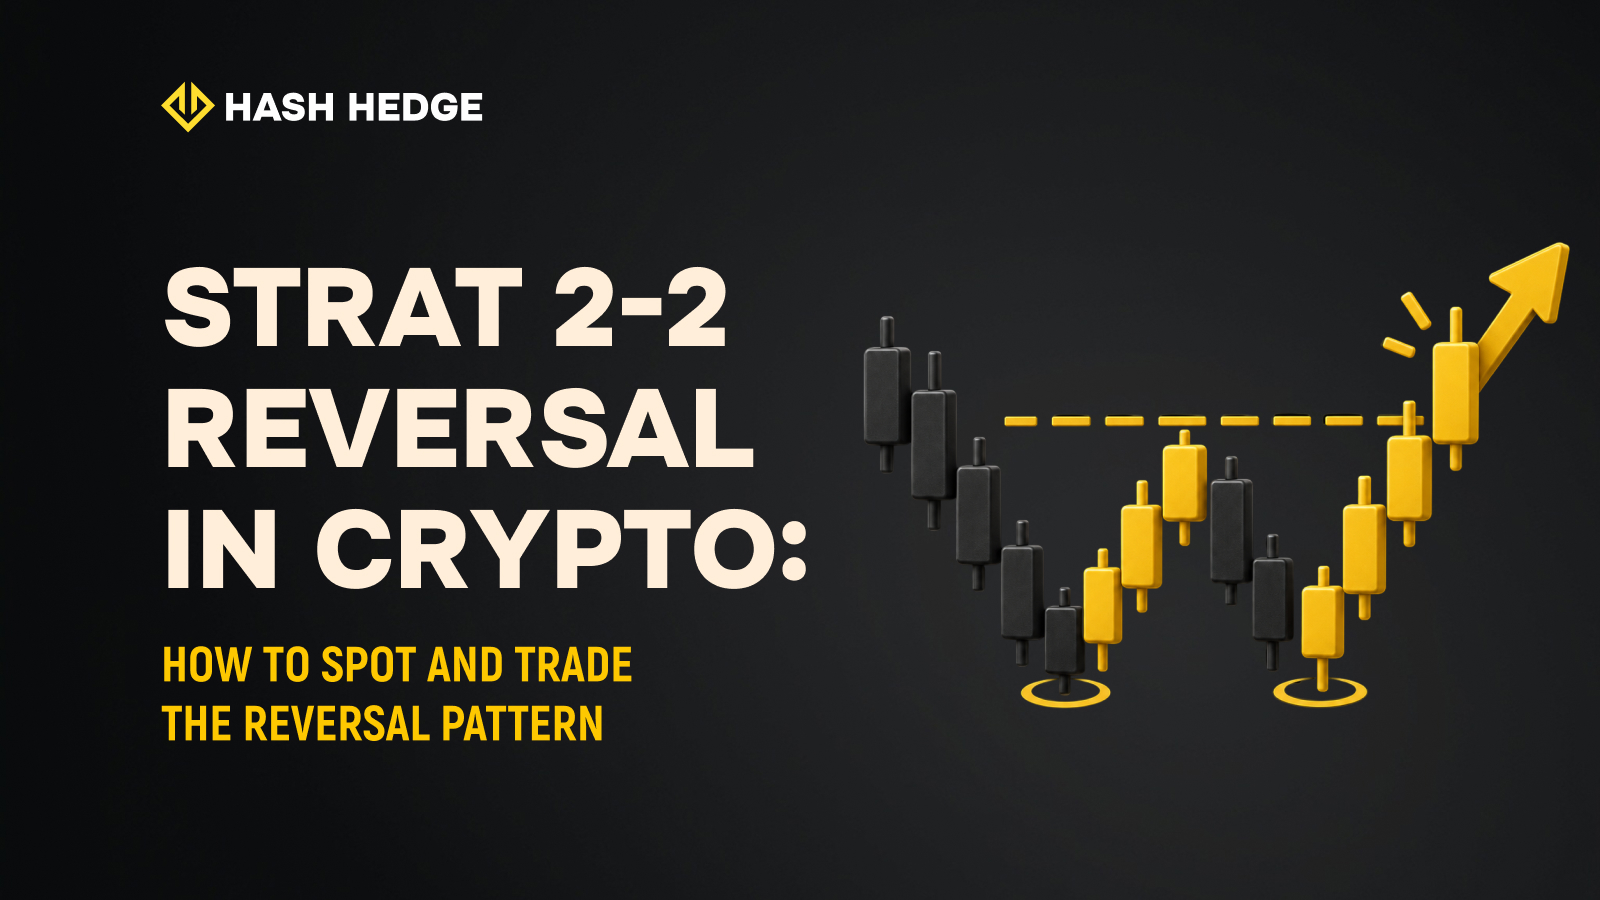
The 2-2 Reversal is one of the best-known patterns in The Strat methodology, but in practice, traders often use it incorrectly.
They enter too early, look for a reversal on the wrong timeframe, or treat the 2-2 structure itself as a sufficient signal to enter a trade.
As a result, the pattern appears on the chart, but the quality of the entry remains low.
In this article, we'll break down how the 2-2 Reversal works in the crypto market, where to look for reversal confirmation, why higher timeframes matter, and how to apply the pattern when trading on a Funded Account.
Table of Contents
What Does a "2" Candle Mean in The Strat?
What Is a 2-2 Reversal and Why Does It Work?
Timeframe Alignment: The Main Filter for the 2-2 Reversal
Why the 2-2 Reversal on BTC and ETH Is Different from Altcoins
How to Identify a Valid 2-2 Reversal Entry
2-2 Reversal and Smart Money: What Do They Have in Common?
2-2 Reversal on a Funded Account
Key Takeaways
What Does a "2" Candle Mean in The Strat?
To understand the 2-2 Reversal, you first need to understand how The Strat classifies candles. What matters here is not the shape of the candle itself, but its position relative to the range of the previous candle.
1 – Inside candle. Its high and low remain within the range of the previous candle. This indicates compression and uncertainty.
2 – Directional candle. Price breaks only one side of the previous candle's range: 2U – breaks the high, indicating an upward move; 2D – breaks the low, indicating a downward move.
3 – Outside candle. Price moves both above the previous high and below the previous low. This represents range expansion in both directions.
Type 2 candles form the basis of the 2-2 Reversal. The sequence first shows movement in one direction, followed by a reversal and a break of the opposite side of the range.
What Is a 2-2 Reversal and Why Does It Work?
The 2-2 Reversal is a two-candle reversal pattern in The Strat. It forms when a directional 2U or 2D candle is followed by a type 2 candle moving in the opposite direction.
Simply put, the first candle continues the move, while the next candle completely changes direction and breaks the opposite side of the previous candle's range.
Bearish 2-2 Reversal: First, a 2U forms and takes out the previous high. Then, a 2D appears and breaks below the low of the 2U candle. This shows that the upward move failed to continue and sellers took control.
Bullish 2-2 Reversal: First, a 2D forms and takes out the previous low. Then, a 2U appears and breaks above the high of the 2D candle. This means sellers failed to continue the move lower and buyers took control.
Why Does the 2-2 Reversal Work in Crypto?
The logic behind the pattern is connected to a shift in direction and liquidity. The first candle moves beyond the previous high or low, where stop orders and pending orders may be located. To market participants, this may initially look like a breakout continuation.
But if the next candle quickly reverses and breaks the opposite side of the range, the initial impulse turns out to be false. This shift in control is what creates the basis for a reversal scenario.
In crypto, these patterns can often be found near visible levels: previous highs and lows, round-number price levels, and daily and weekly levels. Since cryptocurrencies trade 24/7, these reversals can form during different trading sessions rather than only during peak market hours.
Timeframe Alignment: The Main Filter for the 2-2 Reversal
A 2-2 Reversal on its own shows a reversal structure. However, the quality of the signal depends heavily on whether the direction of the trade aligns with the higher timeframes.
What Does Timeframe Alignment Mean in The Strat?
Timeframe alignment means that several timeframes are pointing in the same direction.
For example, if a bullish 2-2 Reversal forms on the 1-hour chart, a bullish structure on the 4-hour and daily charts provides additional confirmation.
In this case, the reversal on the lower timeframe occurs in the direction of the broader market move rather than against it.
If the timeframes conflict – for example, the daily chart remains bearish while a bullish 2-2 Reversal appears on the hourly chart – the pattern still exists. However, the signal becomes weaker because the local reversal is moving against the higher-timeframe context.
How to Check Timeframes Before Entering a Trade
It's best to analyze the market from the top down.
1
Weekly chart
Determine the broader context. What type of candle has formed: 2U, 2D, or 3? Is price remaining within the range or breaking beyond it?
2
Daily chart
Check whether its direction aligns with the weekly timeframe.
3
4-hour chart
Assess the local structure and determine whether it supports the intended trade direction.
4
1-hour or 15-minute chart
Look for the actual 2-2 Reversal and an entry point.
The more timeframes point in the same direction, the stronger the context for the trade.
However, rigid rules such as "three timeframes align – enter; one doesn't – reduce the position" should not be applied mechanically. Timeframe alignment is better used as a filter for setup quality, while position size should be determined separately as part of risk management.
Why the 2-2 Reversal on BTC and ETH Is Different from Altcoins
On Bitcoin and Ethereum, the 2-2 Reversal tends to have greater structural reliability because these markets are liquid enough for candle closes to reflect broader market consensus – a large number of participants agreeing on the direction.
On low-liquidity altcoins, candle closes can be influenced by relatively small amounts of capital, making the pattern less significant.
When trading with a prop firm, look for 2-2 Reversals on BTC, ETH, and top-10 assets by trading volume. Signal quality tends to be more consistent.
More than 160 crypto assets are available on Hash Hedge, but for this particular pattern, liquidity matters.
How to Identify a Valid 2-2 Reversal Entry
To avoid treating every 2-2 Reversal as a ready-to-trade signal, it's important to evaluate the pattern itself, the level where it forms, and the higher-timeframe context.
Step 1. Find the First Directional Candle
Look for a 2U or 2D that breaks a significant high or low. The more visible the level is on the chart, the more interesting the setup may be.
For example, a break above the previous session's high usually carries more significance than a marginal break above the previous candle's high.
Context matters here: liquidity may be concentrated around obvious levels, so the reaction after those levels are taken deserves more attention.
Step 2. Wait for Reversal Confirmation
Don't enter simply because the second candle has started moving in the opposite direction. A completed 2-2 Reversal requires confirmation through a break of the opposite side of the first candle.
For a bearish setup, price must move below the low of the first 2U candle. For a bullish setup, price must move above the high of the first 2D candle.
If your strategy only uses closed candles, consider entering after the second candle has closed or at the open of the next candle.
Step 3. Define the Stop-Loss Level
For a bearish 2-2 Reversal, the Stop Loss can be placed above the high of the first candle. For a bullish setup, it can be placed below the low of the first candle.
The logic is simple: if price moves back beyond this extreme, the reversal scenario is called into question. Since the invalidation level is known in advance, risk can be calculated before opening the position.
2-2 Reversal and Smart Money: What Do They Have in Common?
The 2-2 Reversal can also be viewed through the concept of liquidity. The first candle in the pattern may move beyond a visible high or low where other market participants' stop orders are located. Price then changes direction and forms a reversal.
From a Smart Money perspective, this move may be viewed as a liquidity sweep or false breakout. The Strat describes the same price structure through candle classification.
If a 2-2 Reversal forms near a visible liquidity level and also aligns with the higher-timeframe direction, the trader gets several confirmations supporting the same scenario. However, none of these factors alone guarantees that the trade will work.
2-2 Reversal on a Funded Account
When trading on a Funded Account, the 2-2 Reversal has an important advantage: you can identify the setup's invalidation point and calculate acceptable risk before entering the trade.
This allows you to determine your position size in advance based on the distance to the Stop Loss and your predefined risk per trade.
How to Choose a Timeframe
On lower timeframes, such as 5M and 15M, the pattern appears more frequently, but there is also more market noise. On 1H and 4H, there are fewer signals, but they reflect larger price movements.
When trading on a Funded Account, the specific timeframe matters less than whether the trade fits your risk management. The wider the Stop Loss, the smaller the position size should be for the same level of acceptable risk.
That's why risk per trade, position size, and the Stop-Loss level are best determined before entering the trade, rather than adjusted after the position has already been opened.
Key Takeaways
The 2-2 Reversal is a two-candle reversal pattern in which a type 2 candle is followed by a directional candle moving in the opposite direction. The value of the pattern lies not only in the candle sequence itself, but also in where it forms and the broader market context around it.
Timeframe alignment strengthens the signal. When the higher-timeframe direction aligns with a 2-2 Reversal on a lower timeframe, the setup gains additional confirmation.
It's better to consider an entry after the second candle confirms the reversal, rather than while it is still forming. This helps filter out premature entries before the reversal is fully established.
The Stop Loss is defined in advance and is usually placed beyond the extreme of the first candle. If price moves back beyond this level, the reversal scenario loses strength.
On a Funded Account, one advantage of the 2-2 Reversal is that the Stop-Loss level, acceptable risk, and position size can all be determined before entering the trade.
In the crypto market, it's better to look for the pattern on liquid assets and around visible levels. Low-liquidity altcoins tend to have more market noise, which can reduce the quality of these signals.
Ready to Trade with Prop Firm Capital?
Hash Hedge is a prop trading platform for trading RWA and crypto 24/7. Get funded with up to $200,000 and withdraw up to 90% of your profits in USDT directly to your wallet.
More Useful Articles
False Breakouts and Stop Hunts: A Complete Guide
Position Sizing and Risk Management in Crypto Trading
Why Traders Fail Prop Challenges: Reasons and Solutions